 Download slides
Regional truckload markets affected by winter challenges
Published: Thursday, February 05, 2026 | 09:00 AM CDT
Onthispage
U.S. spot market
The first three weeks of the year saw spot rates decline after the holiday surge, a pattern consistent with seasonal trends and in line with expectations outlined in the January C.H. Robinson Edge Report. With the electricity outages and road closures of Winter Storms Fern and Gianna, spot rates then increased as capacity tightened and freight demand patterns became more uneven. This uptick is expected to be temporary and rates are likely to resume their prior downward trajectory.
Beyond the short-term disruption, the storm has also influenced the 2026 spot rate forecast. With the short-lived bump, rates now appear unlikely to decline as far as previously forecast before the next seasonal increase begins. While the overall shape of the forecast remains intact and underlying market dynamics are unchanged from last month, the recent weather-driven pressures necessitate a modest adjustment.
U.S. spot market forecast: Dry van truckload
The C.H. Robinson 2026 dry van cost per mile forecast is being increased to +10% year over year, up from +8% y/y.
C.H. Robinson spot market dry van truckload forecast
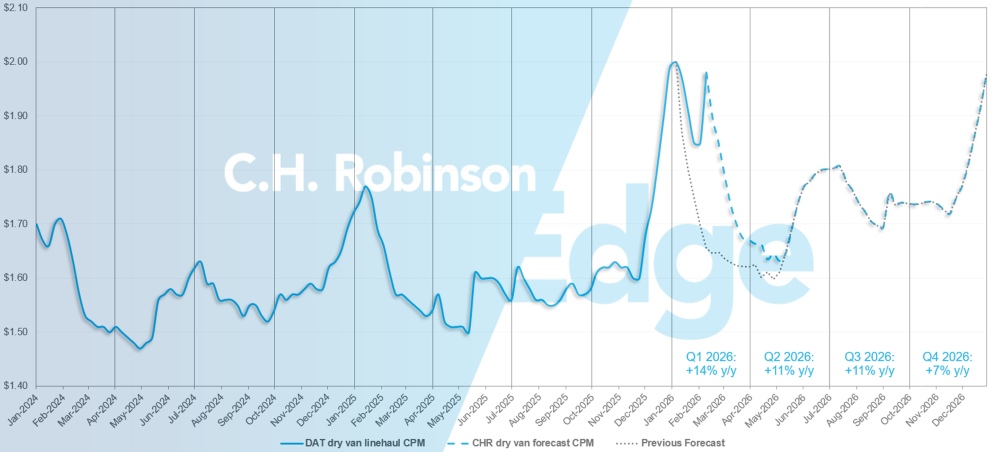
The first week of 2025 saw a dry van load-to-truck ratio of 9.1 to 1, which was the highest all year until a post-Thanksgiving crunch. In the first week of 2026, the ratio of loads to available trucks hit 9.9 to 1, then the impact of the recent winter storms pushed it to 11.1 to close out the month.
While much of the market’s attention remains on dry van freight due to its sheer volume, a more acute story is unfolding in the refrigerated van segment. Refrigerated capacity has tightened far more dramatically. January 2025 began with a load-to-truck ratio of 14.4 to 1.
This year it was 18.8 to 1 for the first week of the year and for the last week in January it shot up to a staggering 26.8 to 1. The first week load-to-truck ratio has only ever been that high back in 2022, during the pandemic, when spot rates were at the peak of the market cycle.
This increased magnitude of tightened capacity reflects more than typical winter disruption. Prolonged and widespread cold weather has forced some freight that would normally move in dry vans, such as beverages, into temperature-controlled equipment to protect them from freezing.
That equipment substitution has layered incremental demand onto an already constrained refrigerated fleet, driving rate volatility beyond what winter storms alone would typically create. This was exacerbated further by the broad reach of the storms.
For shippers with refrigerated freight, elevated volatility is likely to persist through the rest of the winter. Flexibility will be critical to securing reliable coverage at the most competitive rates. Stay closely engaged with your C.H. Robinson account team to navigate these conditions and proactively manage risk.
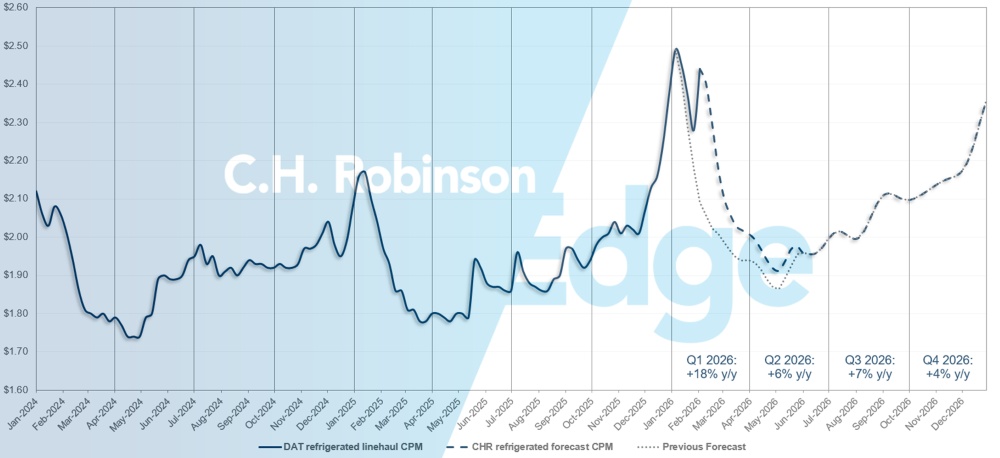
U.S. spot market forecast: Refrigerated truckload
The C.H. Robinson 2026 refrigerated van cost per mile forecast is being increased to +8% year over year, up from +6% y/y.
C.H. Robinson spot market refrigerated truckload forecast
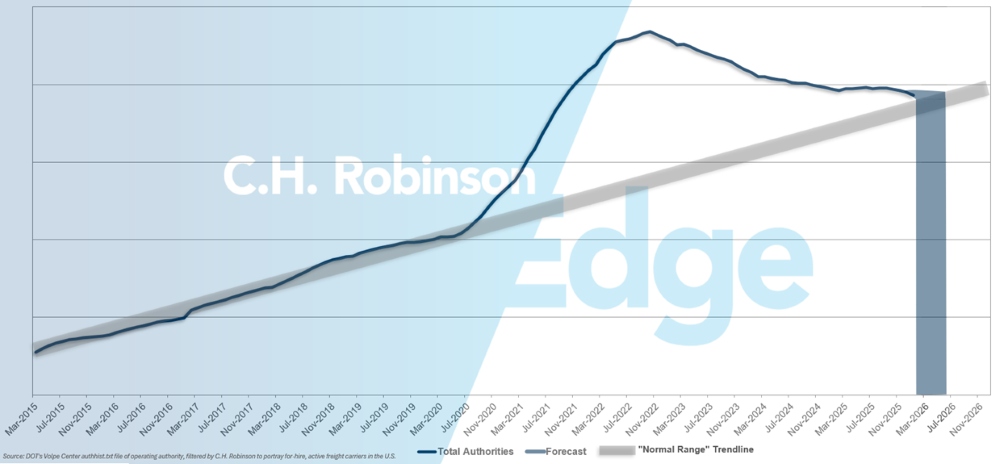
For-hire carrier authorities forecast
If the current pace of U.S. carrier attrition continues, carrier authority counts would return to historical levels in early 2026, possibly later.
For-hire carrier forecast
Contract truckload environment
The following insights are derived from C.H. Robinson Managed Solutions™, which serves a large portfolio of customers across diverse industries.
Route guide depth is an indicator of how far a shipper needs to go into their backup strategies when awarded transportation providers reject a tender. As displayed in the following chart, a route guide depth of 1 would be perfect performance and 2 would be extremely poor. Route guide depth has remained flat at a historically low level for approximately two years, but is recently ticking upward.
For the month of January, route guide depth across all North America deliveries was 1.35, slightly up compared to the previous month.
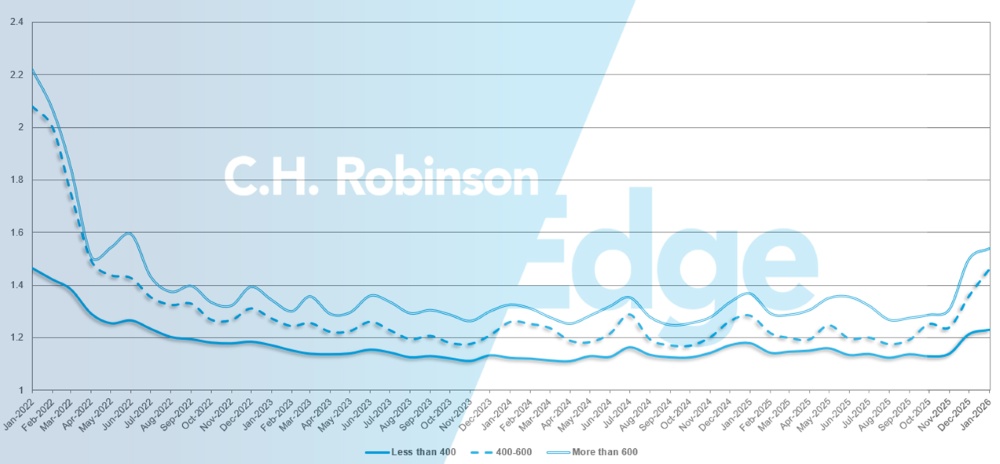
From a mileage perspective, long hauls of more than 600 miles had a route guide depth of 1.54 in January, which is worse than the prior month of December 2025 at 1.50 and worse than January 2025, which was at 1.37. For shorter hauls of less than 400 miles, the route guide depth for January 2026 was 1.23, which is slightly worse than the previous month of 1.22 and worse than January 2025 at 1.18.
North America route guide depth metrics: By length of haul
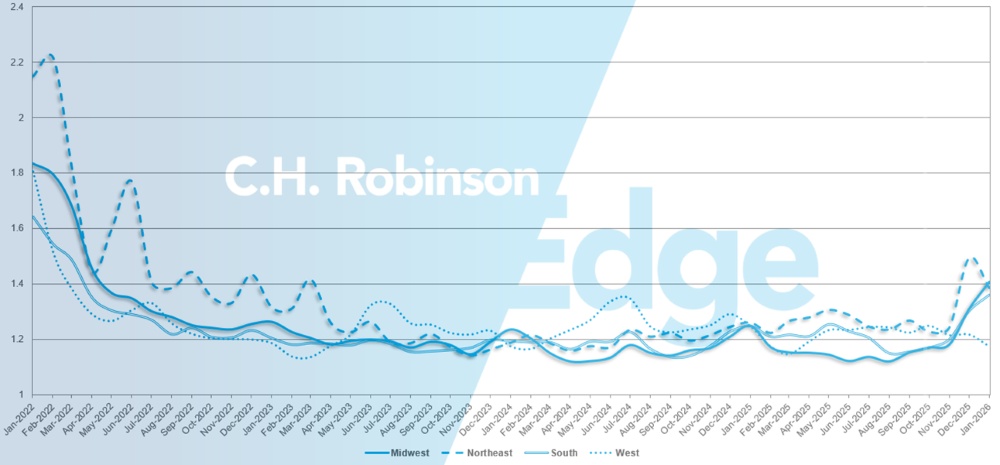
Geographically, the West experienced the smallest change of all regions, improving by 3.5% from the previous month, while the Midwest experienced the largest change, worsening by 7.5%. Route guide depth varies by region, as low as 1.18 for the West and as high as 1.41 for the Midwest.
U.S. route guide depth metrics: By region
Refrigerated Truckload
East Coast United States
The eastern region of the United States experienced elevated costs and higher load-to-truck ratios throughout January, consistent with seasonal trends but amplified by winter storm activity. Market tightness reached levels not seen in some time and those pressures persisted through month-end. Conditions in the Northeast have begun to normalise in early February as weather impacts fade and capacity re-enters the market.
In contrast, the Southeast is expected to remain tight, with elevated costs and limited capacity, particularly out of Florida. The onset of the Valentine’s Day floral season is driving a sharp increase in demand, with more than 4,000 loads expected to move out of the Miami area over the first two weeks of February. This surge will continue to strain capacity and create inflated, day-to-day pricing volatility.
Central United States
The Upper Midwest remains elevated following the holidays, with weather-related disruptions continuing to influence pricing. As storm impacts subside, the market should loosen somewhat, allowing rates to ease. However, any significant weather event could quickly re-tighten conditions.
Capacity is generally available, but pricing is diverging in favour of the cleaner, more efficient freight carriers are prioritising. Arkansas and Missouri continue to see elevated conditions as backlogues from holiday volumes and winter storms work through the system. In Texas, volumes remain active, but the market is expected to soften quickly once recent weather impacts fully clear, with rates likely to fall back toward pre-holiday levels.
West Coast United States
As drivers returned from holiday breaks and networks rebalanced in January, it took a couple of weeks for conditions to normalise. Over the past two weeks, the market has largely stabilised across the region, with only isolated pockets of elevated costs.
Both intra-California and long-haul outbound lanes have followed this trend of declining rates. Looking ahead, west-to-southeast lanes may begin to see additional rate compression as carriers reposition equipment in anticipation of upcoming produce seasons in the Southeast.
Recent winter weather events that disrupted other parts of the country had minimal impact on West Coast capacity. While some shippers shifted freight from ambient to temperature-controlled equipment to protect against freezing, this did not lead to broader rate spikes.
As the region moves toward the midpoint of Q1, most West Coast lanes are expected to follow historical patterns and continue softening gradually, barring any major weather events or unexpected capacity disruptions. Overall, conditions are steadily normalising after early-January volatility.
Flatbed truckload
Winter weather causing flatbed volatility
Winter weather continues to be the primary driver of short-term volatility in the flatbed market. Snow and ice storms have created temporary capacity constraints and uneven supply-and-demand conditions, particularly in regions where carriers are avoiding hazardous lanes or experiencing delays at origin and destination.
In January, the load-to-truck ratio increased from approximately 27 to 1 at the start of the month to approximately 47 to 1 by month’s end, with contract rates and spot rates increasing in the low single digits. While these increases have been contained, they underscore how quickly weather can influence flatbed dynamics during the winter.
Cold weather also lowers carrier efficiency. It can slow loading and unloading, especially if ice, snow or high winds restrict access to job sites. It can complicate load securement when tarps, straps or dunnage are frozen. Carriers also face heightened risks of slipping or falling while drivers are tarping or strapping loads. In response, many carriers reposition trucks south or west to minimise weather exposure, while others favour shippers with indoor loading facilities and heated waiting areas.
Other conditions to expect this month:
- Equipment such as Conestogas and curtain-side trailers—often preferred in winter for faster, more protected loading—remains limited and is frequently concentrated within regional fleets.
- Most permitted or over-dimensional loads are restricted to daylight travel, reducing daily miles during shorter winter days and further tightening effective capacity.
Looking ahead, February typically marks the early stages of the seasonal ramp toward more construction activity. This period rarely brings abrupt market shifts, rather a gradual firming as weather conditions improve and projects begin to mobilise.
Activity tied to infrastructure and construction projects will be an important indicator to watch, particularly as information about government grants and public-sector funding becomes available. As awards are finalised and timelines become clear, it can offer early insight into where flatbed demand may emerge heading into spring.
Remain flexible as the market transitions to construction season
Flexibility remains critical in this environment. During weather-driven disruptions, adaptability around ship dates, routeing and equipment selection can meaningfully reduce delays and cost exposure. As the market transitions toward the construction season, proactive planning and close co-ordination will be essential to managing risk.
Keep monitoring weather impacts, regional capacity shifts and early construction signals, while staying closely connected with your logistics provider to navigate near-term volatility and prepare for the seasonal upswing ahead.
Voice of the Carrier
Observations from a cross-section of the contract carriers in the C.H. Robinson network:
Market
- Spot load availability and rates have increased due to winter storms, but carriers broadly view this as transient and unlikely to persist through the back half of Q1.
- Recent rate increases are primarily focused on cost recovery rather than margin expansion, as rates still do not fully offset carriers’ rising insurance, maintenance and operating expenses.
- Carriers are prioritising network discipline, shedding freight that is not closely aligned with their footprint and leaning into niche segments (flatbed, pharma, specialised) where rates are more resilient.
Drivers
- Driver availability remains generally adequate, though retention and turnover trends vary significantly by carrier and operating model.
- Some fleets are experiencing elevated turnover, while others report stable driver pools supported by selective hiring and disciplined fleet strategies.
- Overall, labour pressures are present but not yet a binding constraint on capacity, particularly compared to equipment and cost challenges.
Equipment
- Fleet size decisions remain highly deliberate across carriers of all sizes.
- Several carriers have reduced equipment over the past 18-36 months and are unable or unwilling to grow without sustained market improvement.
- Any capacity growth is expected to be incremental, demand-driven and regional, often achieved through redeploying parked assets rather than new equipment orders.
 Actionable freight insights